Download Log File
For support purposes, we may ask you to send us a log file from your device. There are two types of log files:
Note
We only offer support services to customers who ordered directly from us. Please contact your dealer.
The Download Debug Log File function refers to the log file that is downloaded directly from the EZCast Pro device.
With the Debug Over IP procedure, the debug information is read via your network infrastructure using terminal software and saved into a log file.
Download Debug Log File
You need to activate the Engineer Mode and select the Download Debug Log function. With the Advanced Settings feature, you can log in and download the log file using any web browser.
Open Advanced Settings
- Connect your device to the EZCast Pro II device, either via the SSID of the EZCast Pro II device or the same Wi-Fi or LAN infrastructure to which the EZCast Pro II device is connected:
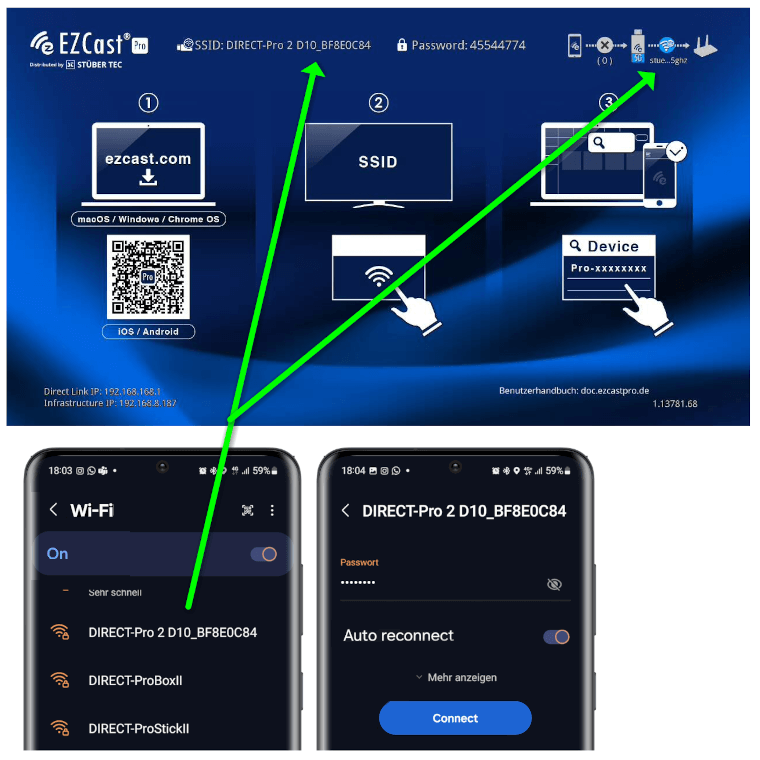
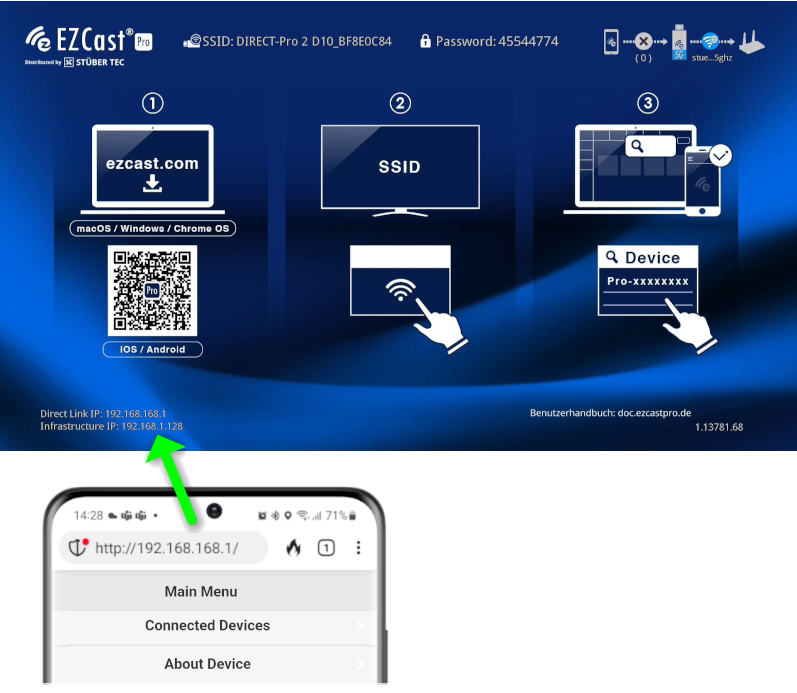
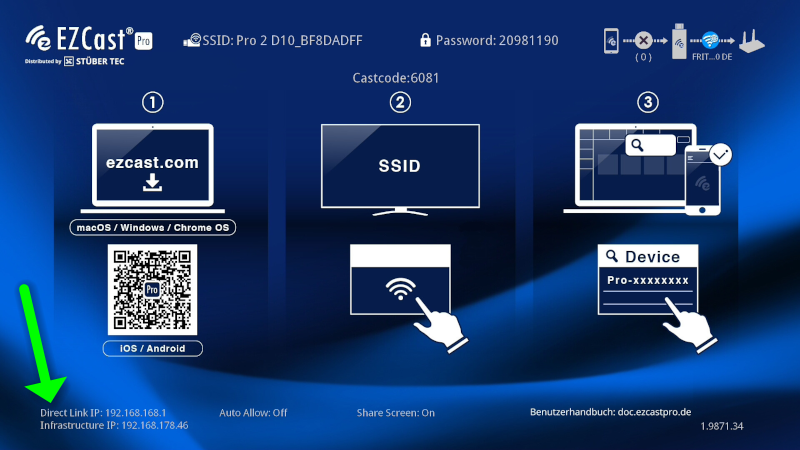
- Enter the IP address of your EZCast Pro device in any web browser, which is displayed at the bottom left of the home screen:
Log in as Admin
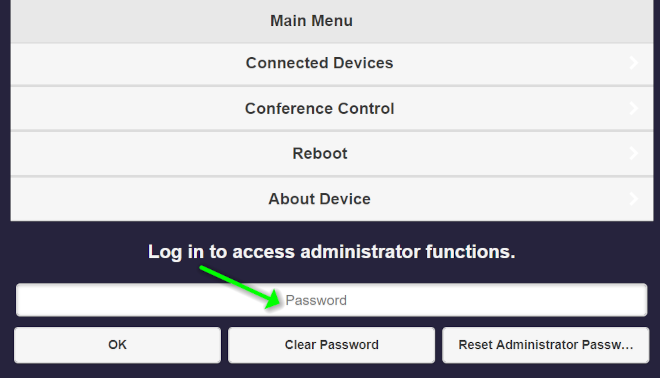
- Enter the admin password and click OK to log in. The default password is
000000. If this password is not accepted, reset the device using the Reset switch.
Activate Engineer Mode
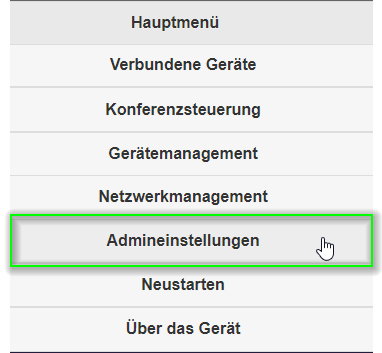
- From the main menu, select
Admin Settings:
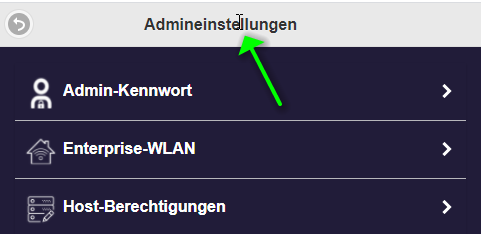
- Click nine times in a row on the
Admin Settingstext:
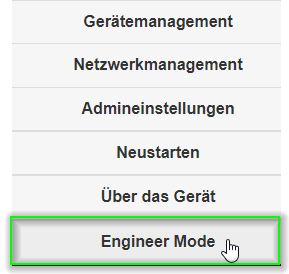
- Click
Back, then select theEngineer Modemenu item:
Enable Syslog
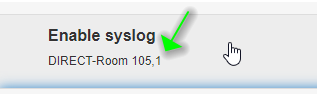
- Click once on the
Enable Syslogfunction until the last digit shows a1:
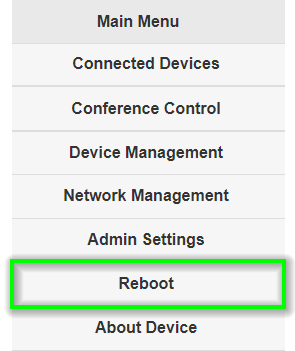
- To activate the setting, restart the EZCast Pro device. In the main menu, select
Restart.
- Then click the
Restartbutton again.

Reproduce the Error
At this point, you should try to reproduce the issue so that the action / error is recorded in the log. For example, you can try a previously failed Miracast connection using [Windows] + [K].
Download Debug Log File
- In the
Engineer Modemenu, click theDownload Debug Logfunction. A log file will be downloaded:
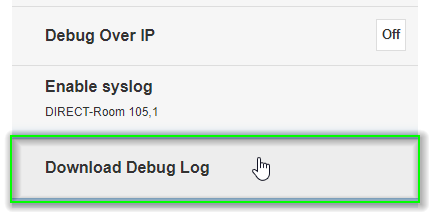
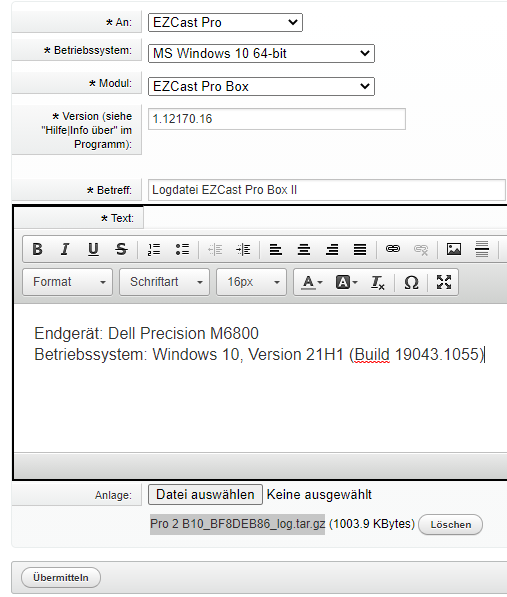
- Please send us the log file via our ticket system.
Disable Syslog
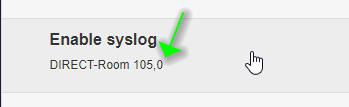
- Click once on the
Enable Syslogfunction until the last digit shows a0:
Disable Engineer Mode
- From the main menu, select
Engineer Mode:
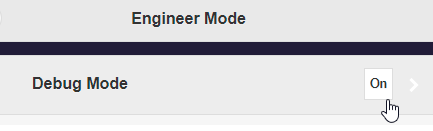
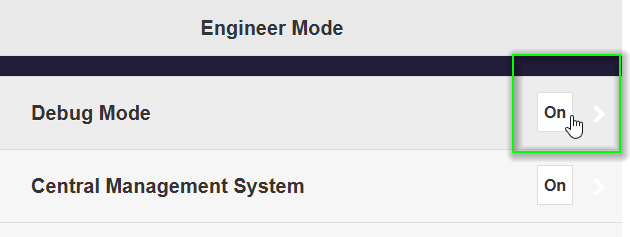
- Deactivate the
Debug Modein order to disable Engineer Mode:
- To finalize the setting, restart the EZCast Pro device. In the main menu, select
Restart.
- Then click the
Restartbutton again.
Perform Debug Over IP
You need to activate the Debug Over IP function and read the process information of the EZCast Pro device. The data is then saved into a log file.
With the Advanced Settings feature, you can log in and download the log file using any web browser.
Open Advanced Settings
- Note the IP address displayed at the bottom left of the home screen.
- Now open your web browser.
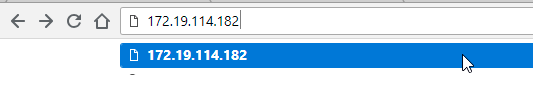
- Click in the address bar of the browser and enter the IP address of the EZCast Pro device.
Log in as Admin
- Enter the admin password and click OK to log in. The default password is
000000. If this password is not accepted, reset the device using the Reset switch.
Activate Debug Over IP
- From the main menu, select
Admin Settings:
- Click nine times in a row on the
Admin Settingstext:
- Click
Back, then select theEngineer Modemenu item:
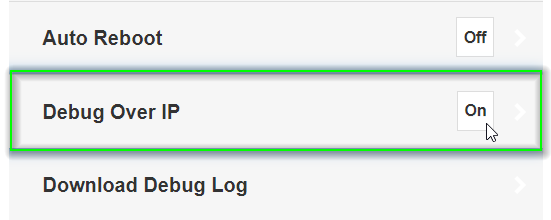
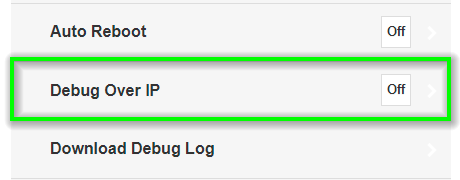
- Click the
Debug Over IPfunction to activate the network service. A log file will be downloaded:
- To activate the setting, restart the EZCast Pro device. In the main menu, select
Restart.
- Then click the
Restartbutton again.
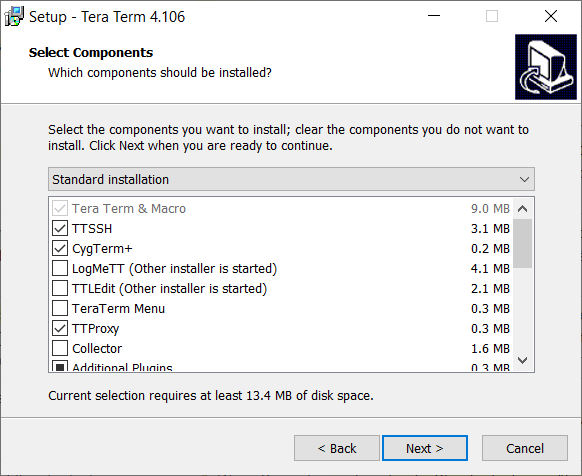
Download the terminal software Tera Term and run the installation package:

- You can accept the default settings:
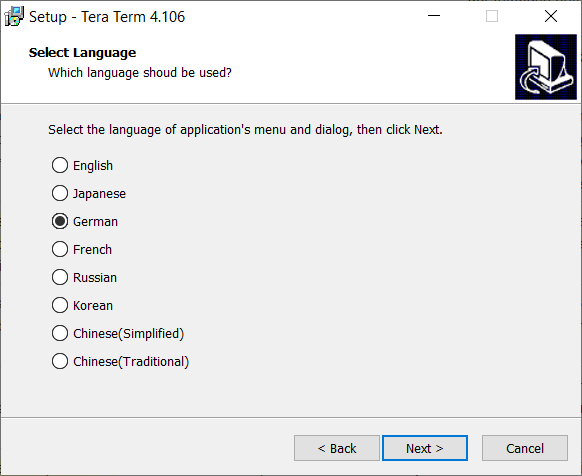
- Select your preferred language:
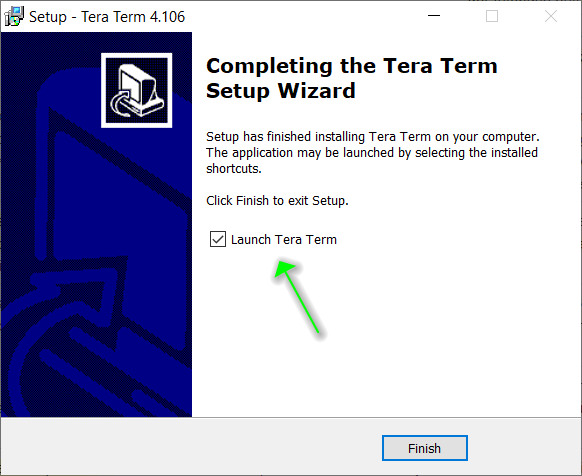
- At the end of the installation, check
Launch Tera Termand clickFinish:
- Note the IP address displayed at the bottom left of the home screen.
- In the
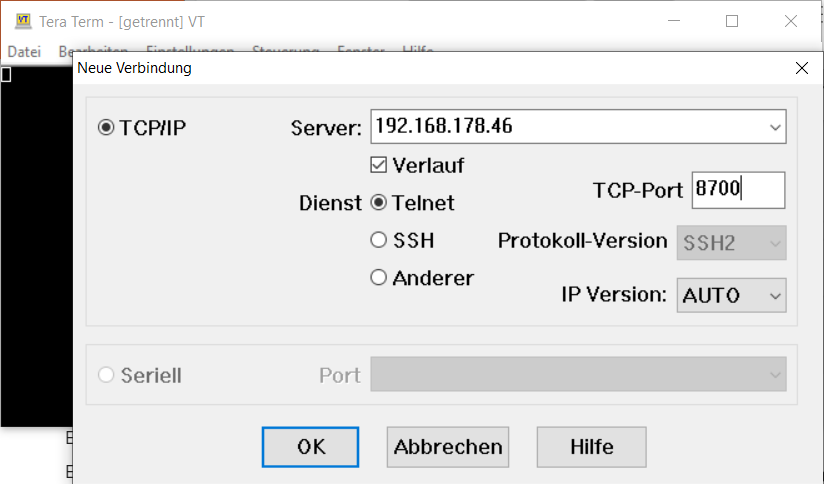
New Connectiondialog window, enter the IP address of your EZCast Pro device and the TCP port8700, and select the serviceTelnet. Your computer must be on the same network as the EZCast Pro device:
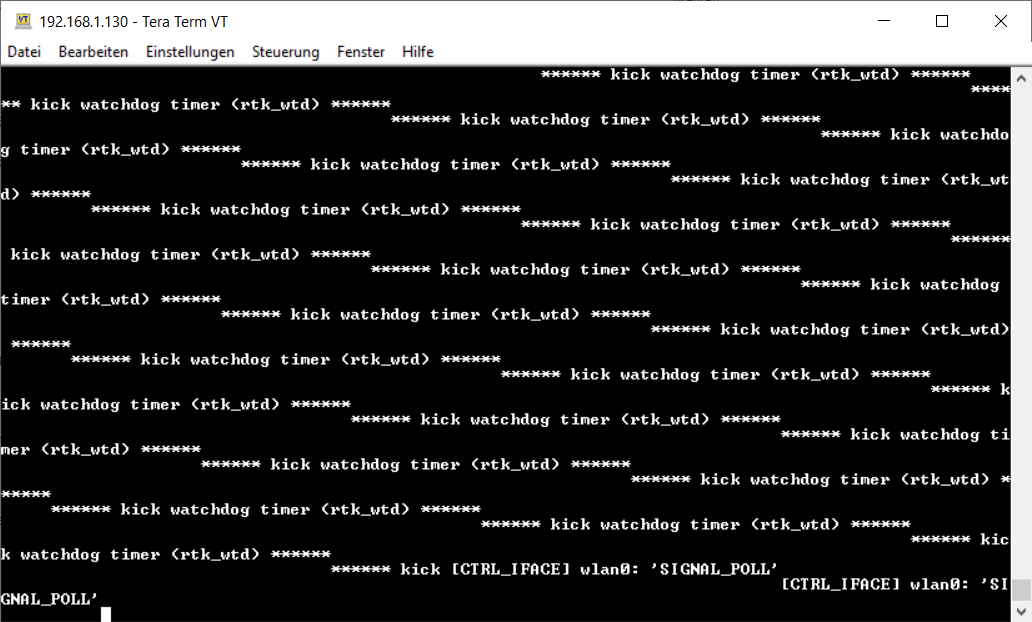
- If the connection is successfully established, the process information will be displayed in the Tera Term window:
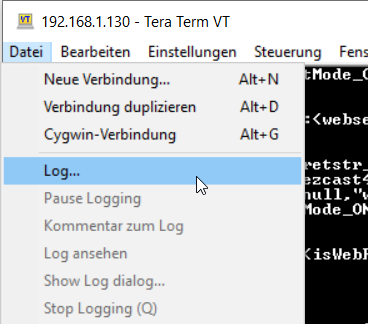
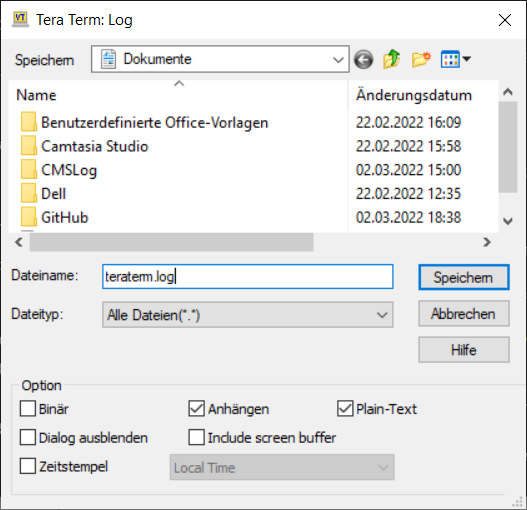
- Under
File->Log..., save the log file in theDocumentsfolder:
Note
At this point, all activities of the EZCast Pro device are recorded into the log file. Now you must reproduce the events that caused the issue, e.g., perform the touchscreen gestures that triggered the problem, so that the issue recurs and is logged in the file.
- Please send us the log file via our ticket system.
Deactivate Debug Over IP
- Finally, at the end of the procedure, you can deactivate the Debug Over IP function again:
- To hide the
Engineer Modeagain, click theDebug Modefunction. You will return to the main menu: